Welcome to my blog
2025-05-19
1 / 3
Blog
2025 SuperNationals VIII: A Once-in-Four-Years Chess Spectacle
Yang Liu
/
2025-05-15
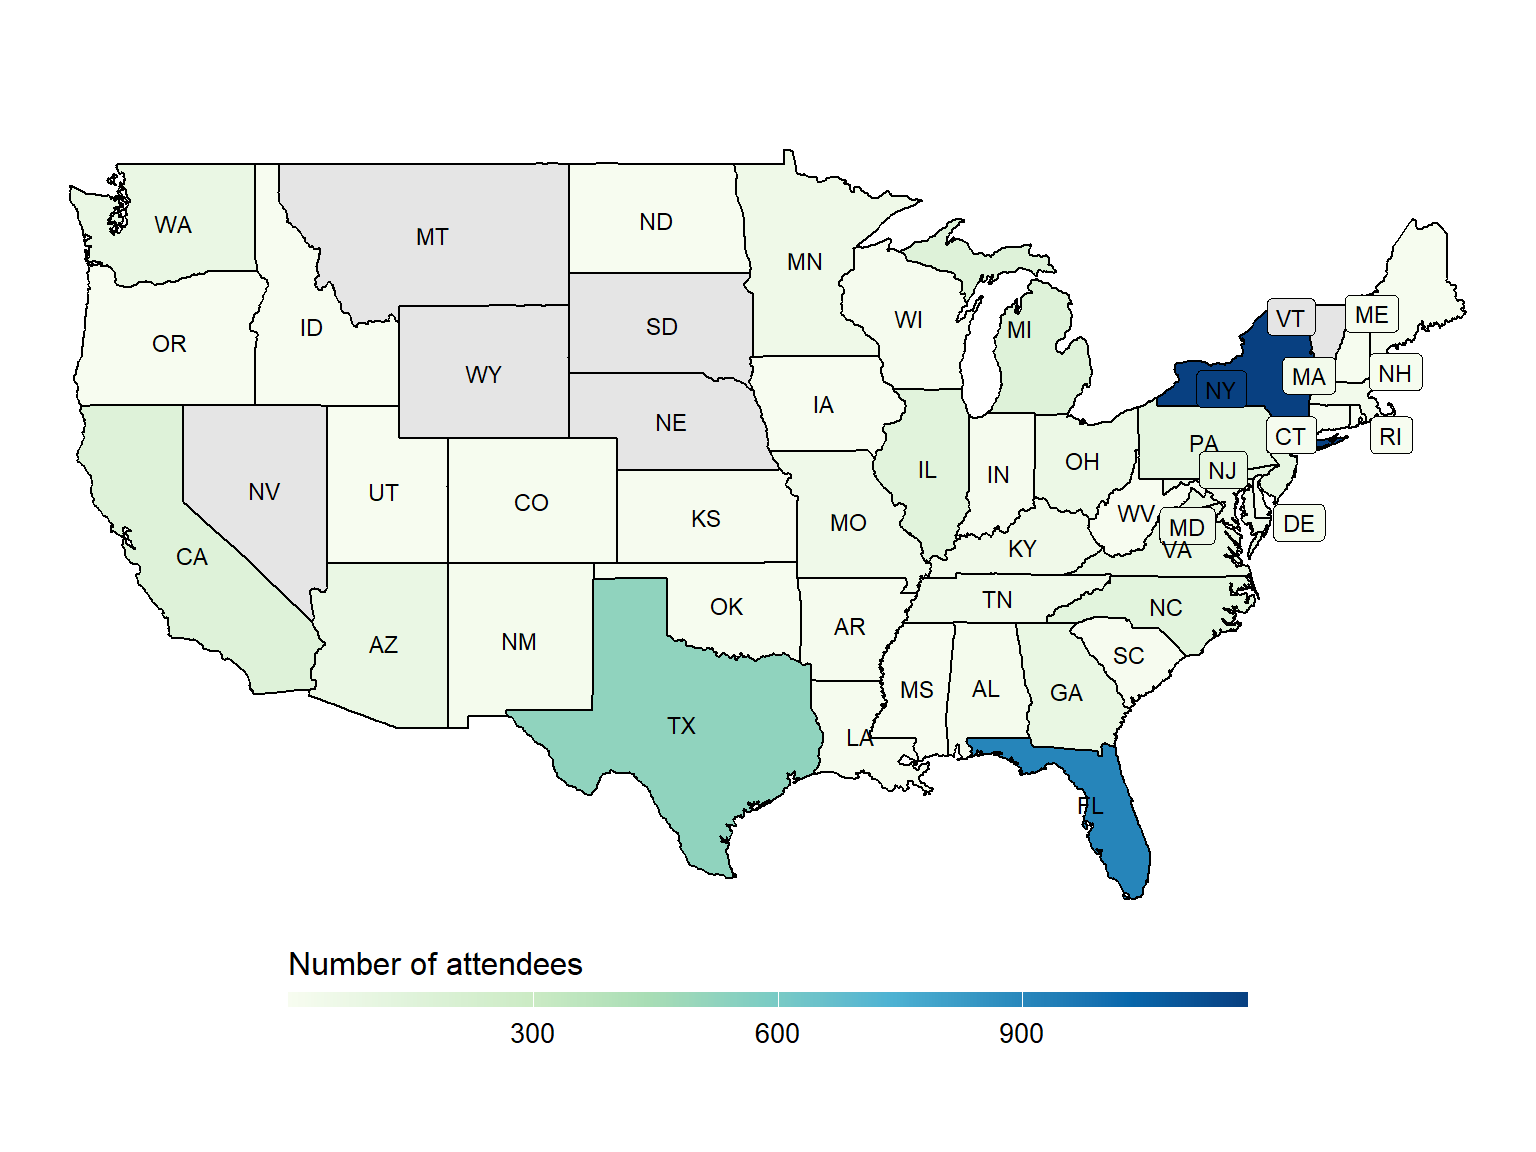
Statistics of the 2025 SuperNationals VIII in Orlando https://www.uschess.org/results/2025/sn8/ […] The 26 sections covering K-12 grades attracted over 4,600 attendees from 47 states. There are 1,174 attendees (25%) from New York, followed by Florida with 910 attendees (20%) and Texas with 523 attendees (11%). Over half of the attendees are from these three states. […] One major…
Blog
2024 National K-12: Does a Higher Rating Lead to a Higher Standing?
Yang Liu
/
2024-12-15
Statistics of 2024 National K-12 Grades Championship https://www.uschess.org/results/2024/k12/ Update: An interactive chart of all players has been added […] The 2024 National K-12 Grades Championship attracted a total of 2,679 participants from 43 states. More than 1,000 participants (40%) came from New York, followed by Virginia with 250 participants (9%) and New Jersey with 218…
Data Visualization
How many children under 5 worldwide?
Yang Liu
/
2024-12-13
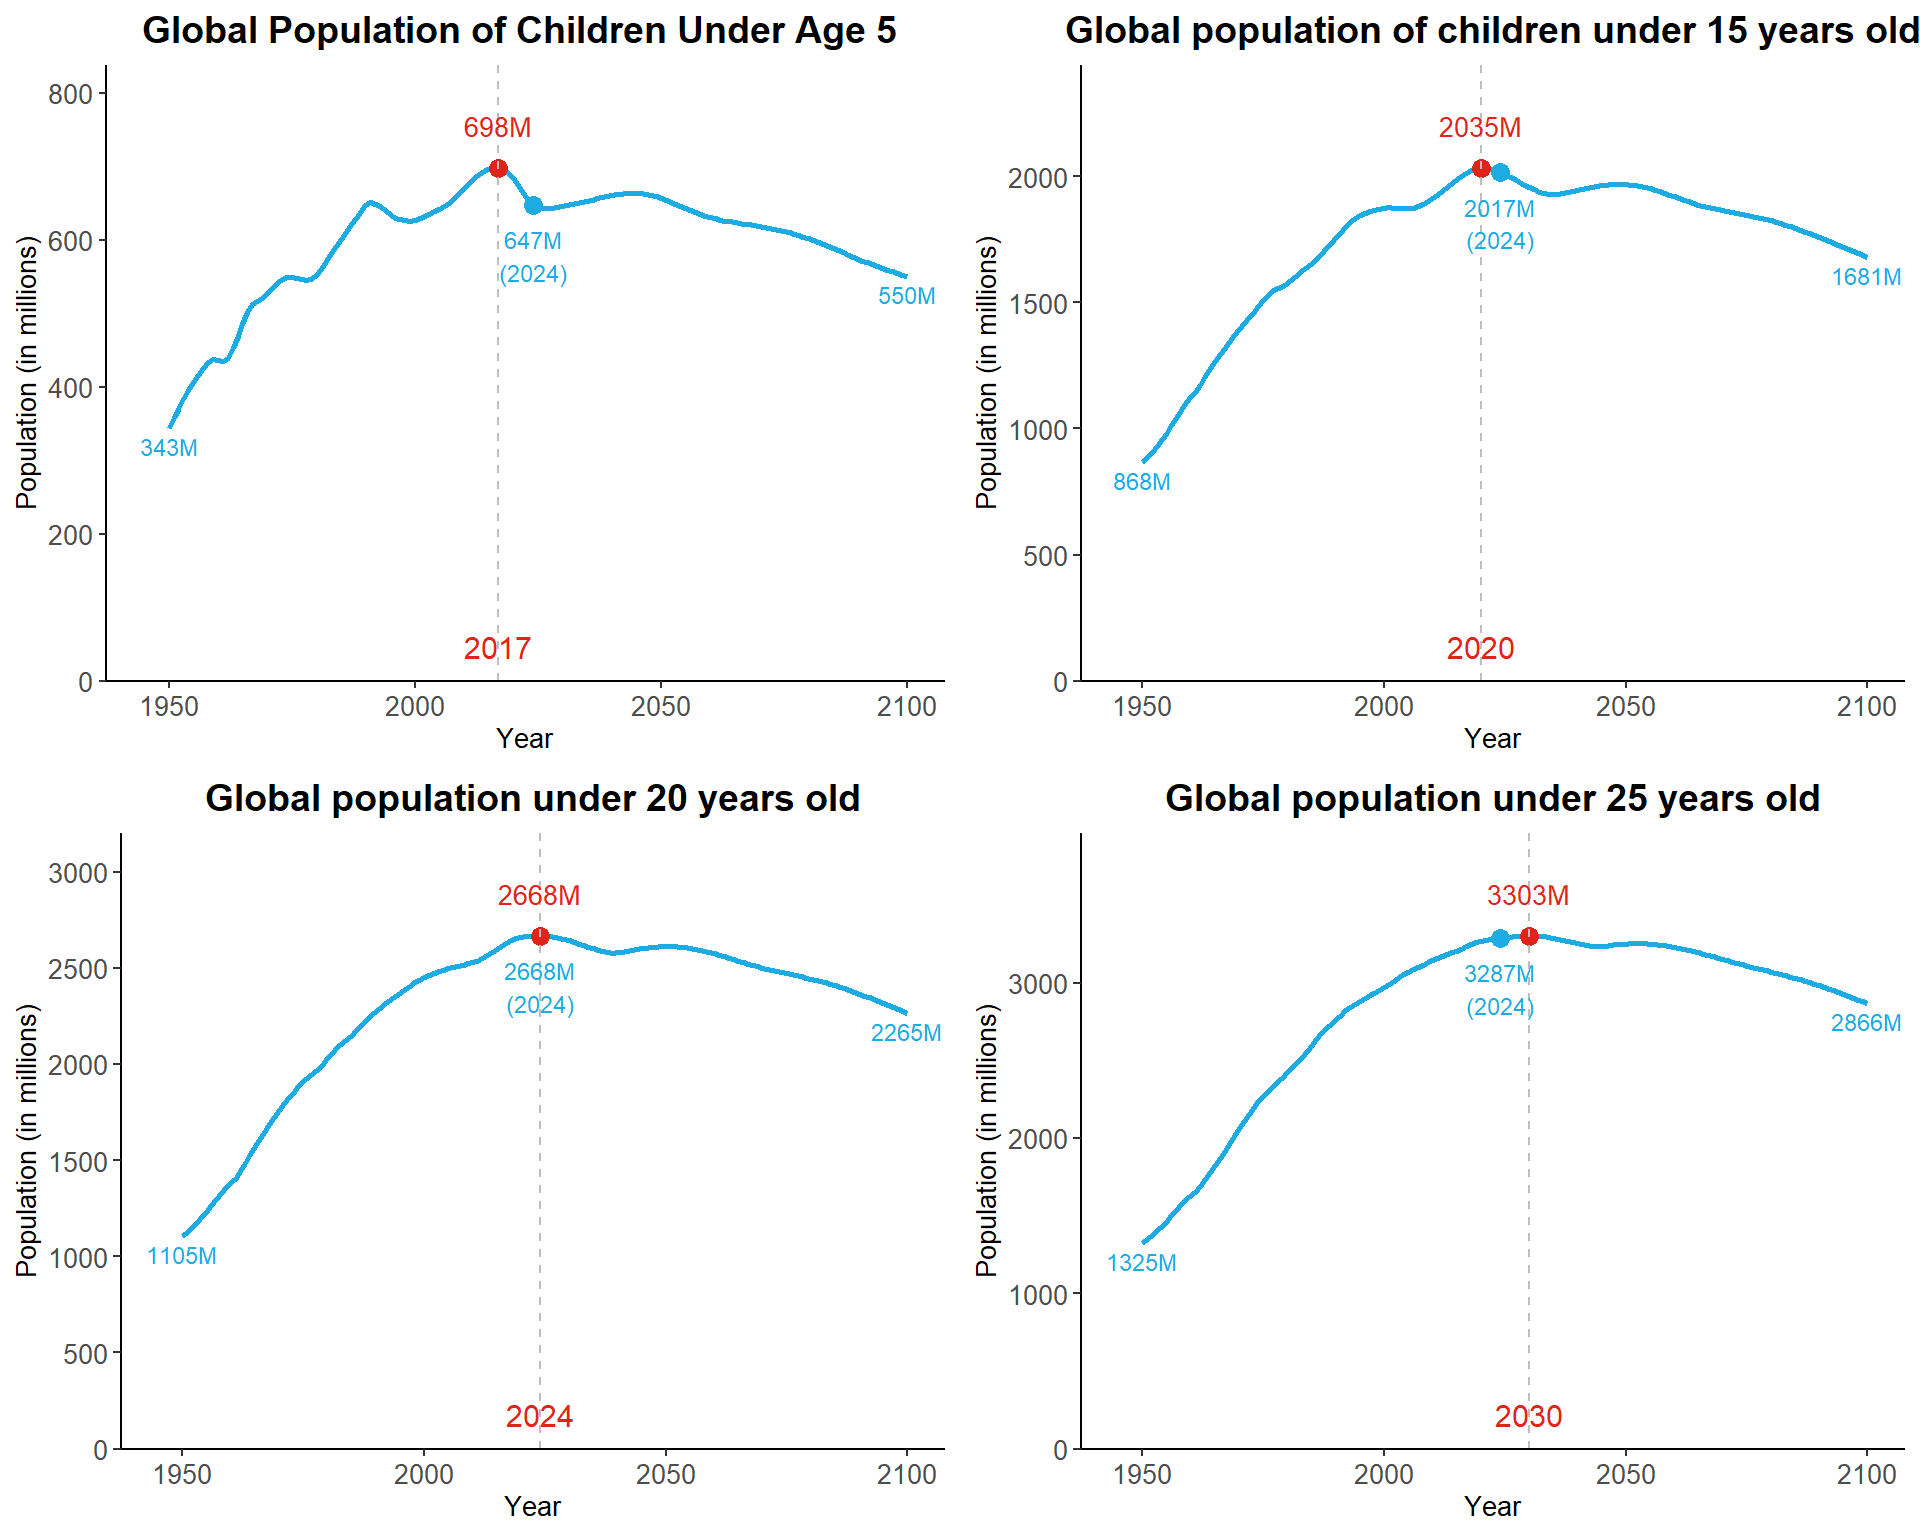
Since these figures are not directly available via Google search, I calculated them using the mid-year population estimates from the World population Prospects (WPP) 2024: World population: In 2024, the World population is estimated at 8.2 billion (8,162 million). The population is projected to peak in 2084 at 10.3 billion. Children Under 5 Years Old: The number of children under 5 is 647 million…
Data Visualization
Plot multiple countries on the world map
Yang Liu
/
2023-05-29
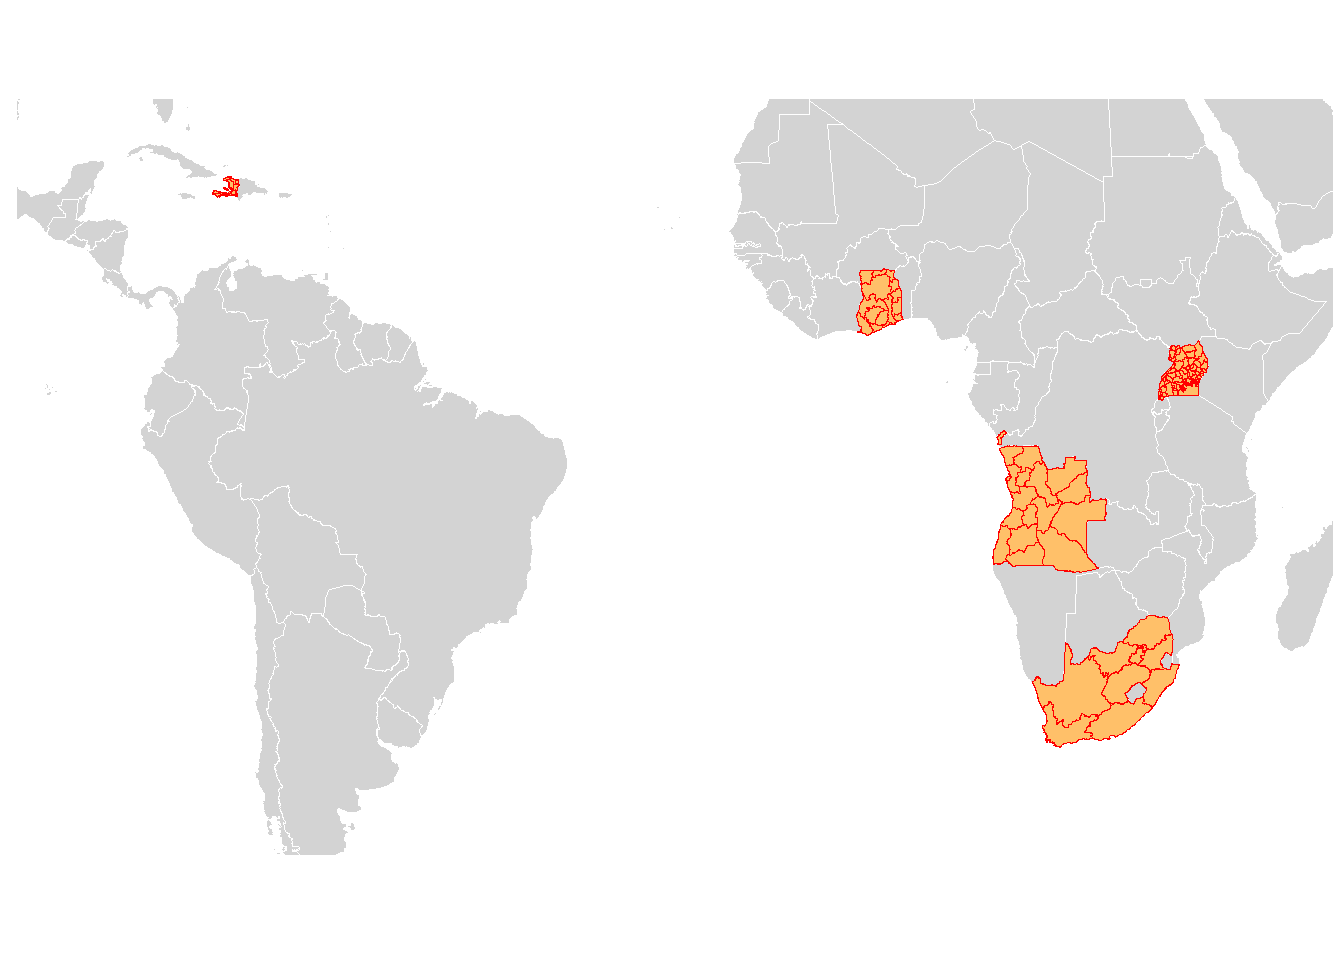
This post will show it’s quite easy to download and plot the administrative areas of multiple countries on the world map. I will also showcase a bug that puzzled me for a long time and I recently figured out: strange connecting lines among countries! […] (You may download the world map from Github) suppressPackageStartupMessages({ library("data.table") library("ggplot2")…
Github
RMarkdown to Github Pages
Yang Liu
/
2021-01-06
Example of one of my Github pages: You might have read this GitHub and RStudio tutorial by searching this topic. It is quite long and confusing as it tries to teach Git at the same time. You don’t need any of those branch operations. And the example yaml code is not indented correctly (corrected below). Here is the short version: […] Make sure the yaml format is indented correct. Most…
Data Visualization
US and China Admin1 COVID19 mortality and incidence rate
Yang Liu
/
2020-06-14
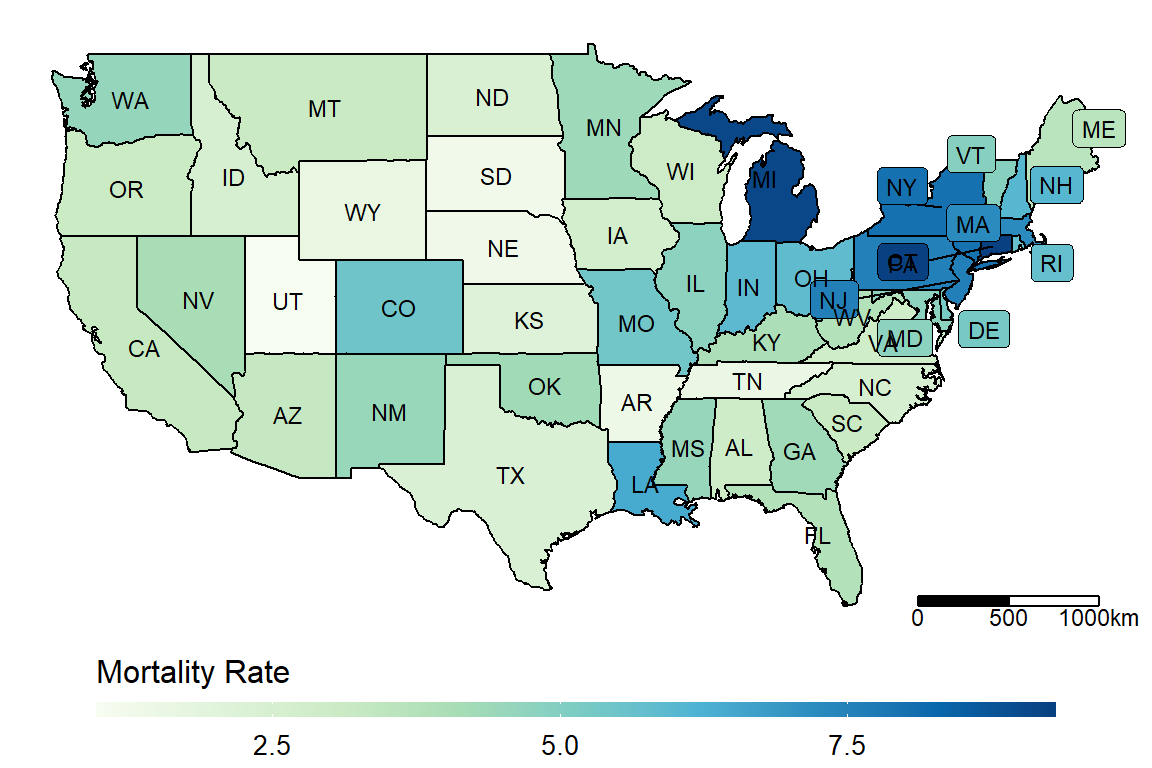
Similar to the last heatmap post I just revised, here I wrapped up the function and showing COVID-19 data just downloaded from JHU CSSE Github page. The function can take a given dataset and plot designated variable. Code hosted on my Github repo. […] # major function, can download from Github repo Blogdown/hugo-xmag/Code source(here::here("Code/COVID_make_map.R")) # US dt_JUH_US…
««
«
1
2
3
»
»»