Welcome to my blog
2025-05-19
3 / 3
Machine Learning
Study shrinkage and DART in xgboost modeling using a simple dataset
Yang Liu
/
2018-11-15
It is always a good idea to study the packaged algorithm with a simple example. Inspired by my colleague Kodi’s excellent work showing how xgboost handles missing values, I tried a simple 5x2 dataset to show how shrinkage and DART influence the growth of trees in the model. […] set.seed(123) n0 <- 5 X <- data.frame(x1 = runif(n0), x2 = runif(n0)) Y <- c(1, 5, 20, 50, 100) cbind(X,…
Machine Learning
SHAP Visualization in R (first post)
Yang Liu
/
2018-10-14
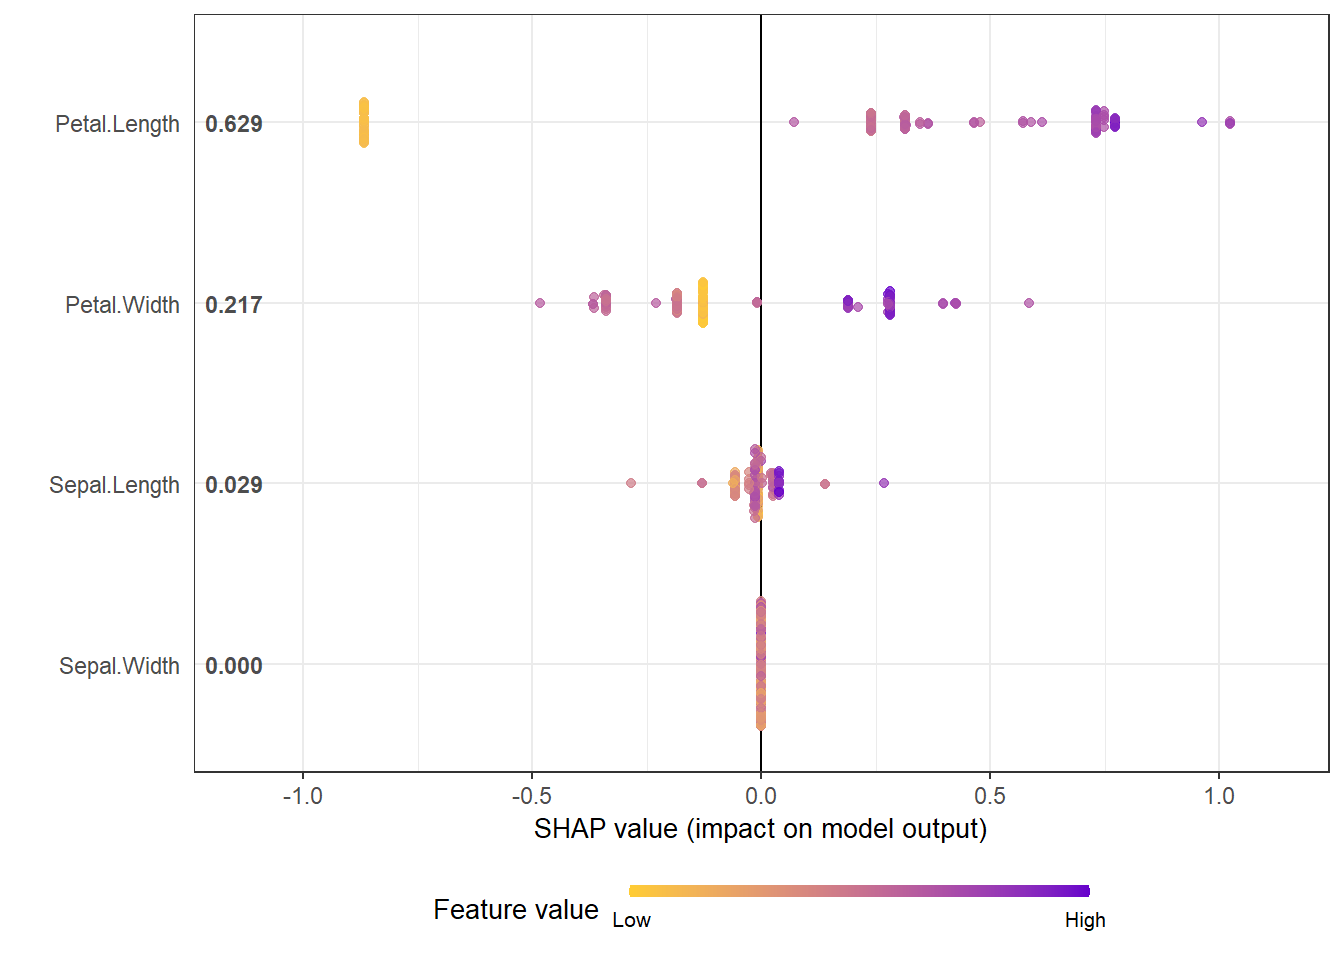
Update 19/07/21: Since my R Package SHAPforxgboost has been released on CRAN, I updated this post using the new functions and illustrate how to use these functions using two datasets. For more information, please refer to: SHAP visualization for XGBoost in R […] This is the example I used in the package SHAPforxgboost # Example use iris suppressPackageStartupMessages({…
Data Visualization
Spatial data in R: Dividing raster layers into equal-area rings
Yang Liu
/
2018-07-20
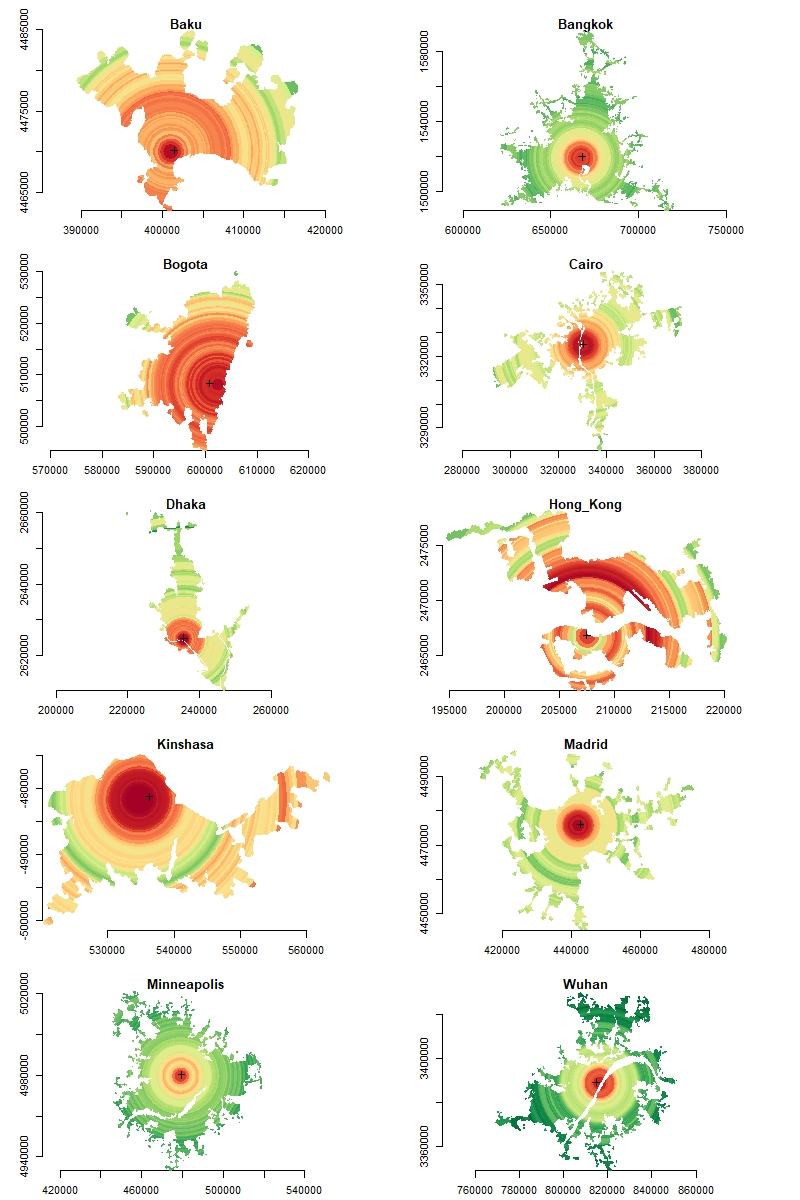
This data visualization example include: * Import .img file as a raster * Turn raster into a data.frame of points (coordinates) and values * Dividing the points into 100 equal-area rings * Calculate Built-up Area/Urban Extent for each ring * Turn dataframe into raster * Plot multiple figures on the same color scale […] […] list.of.packages <- c("raster",…
Data Visualization
How to Draw Heatmap with Colorful Dendrogram
Yang Liu
/
2018-07-16
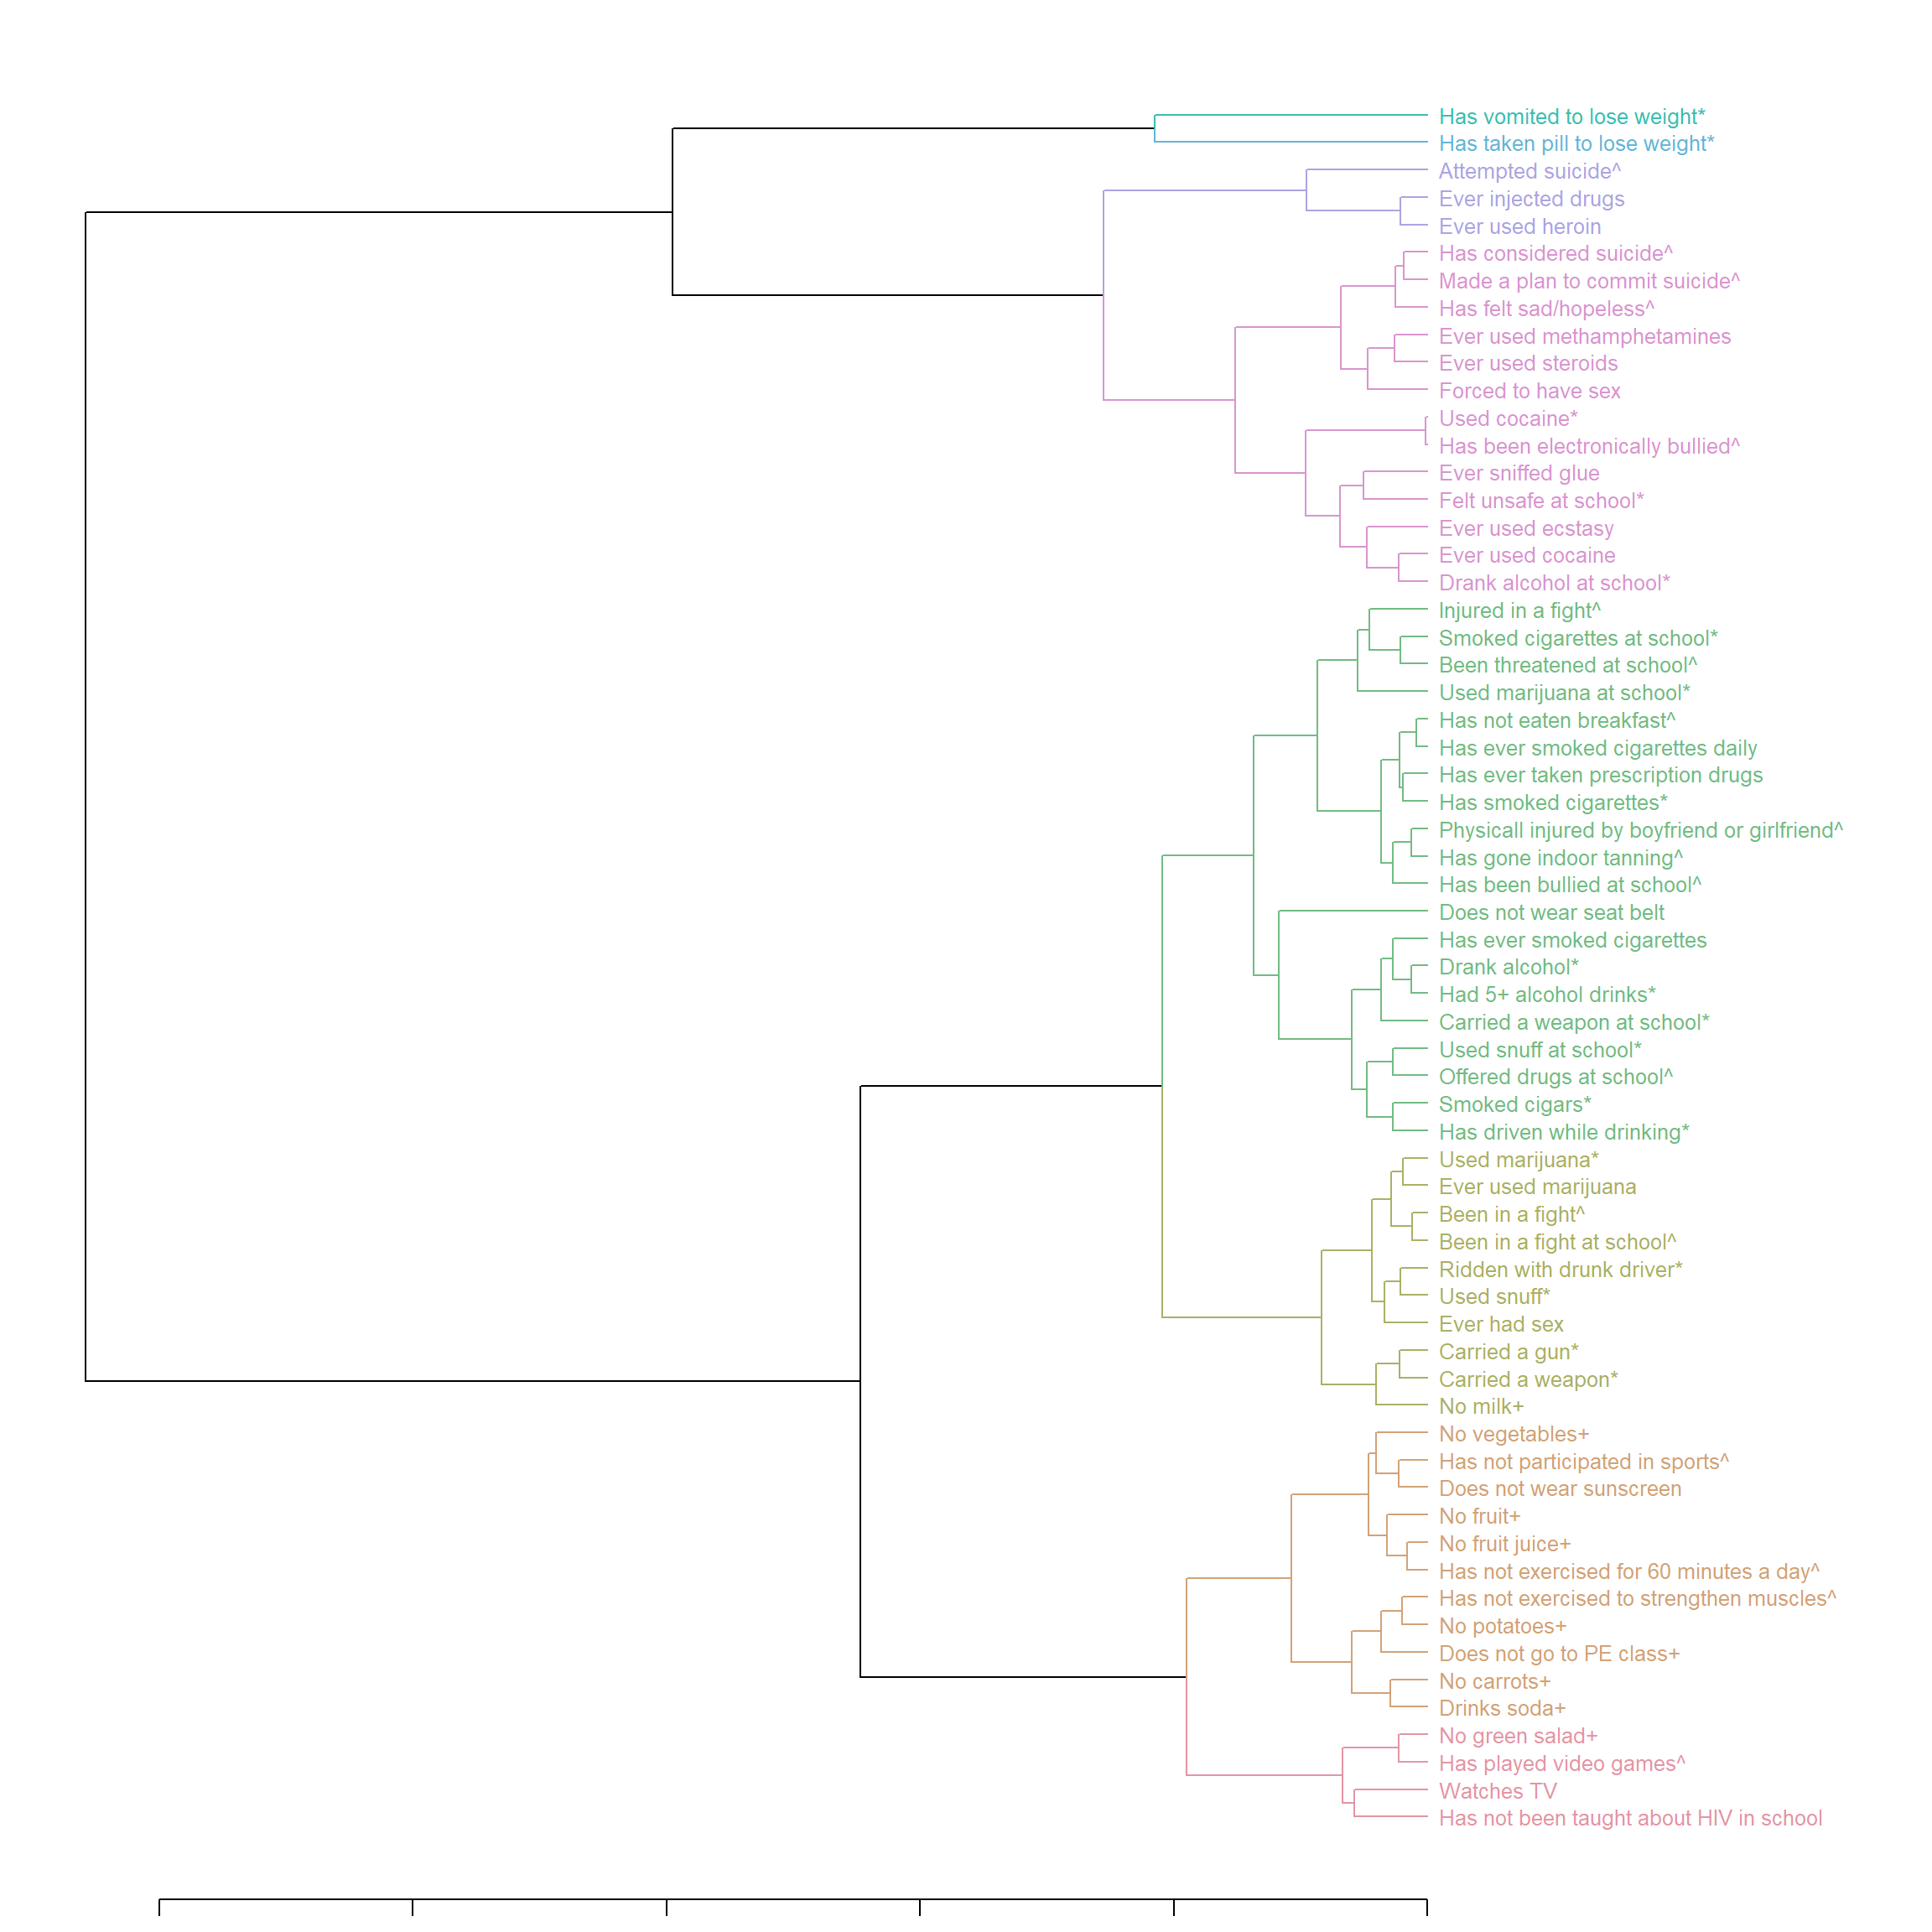
This data visualization example include: * Hierarchical clustering, dendrogram and heat map based on normalized odds ratios * The dendrogram was built separately to give color to dendrogram’s branches/labels based on cluster using dendextend * Heatmap is made by heatmap.2 from gplots using the built dendrogram * The rows are sorted by means from highest to lowest, it can be done in either the…
Catalog
Catalog of my old blog
Yang Liu
/
2018-07-01
When I realized it was so convenient to write blog directly using R Markdown, I searched if there is a specific tool for it. And I found Blogdown, an R package developed by Yihui Xie, who also developed R Markdown. […] As a summary, I would like to create a catalog for the main topics I wrote on google blogger before July 2018. I included some figures too, most were created in R. 1. Details…
««
«
1
2
3
»
»»