Catalog of my old blog
Catalog
A historical catalog of posts from my earlier Blogger site, with links to older work on statistics, data visualization, R programming, and urban research.
About this archive
This page preserves a catalog of posts from my earlier Blogger site before I moved my research notes into an R-based blog. Most of the linked work is exploratory, but it still captures useful examples in statistics, visualization, R programming, and urban research.
Catalog
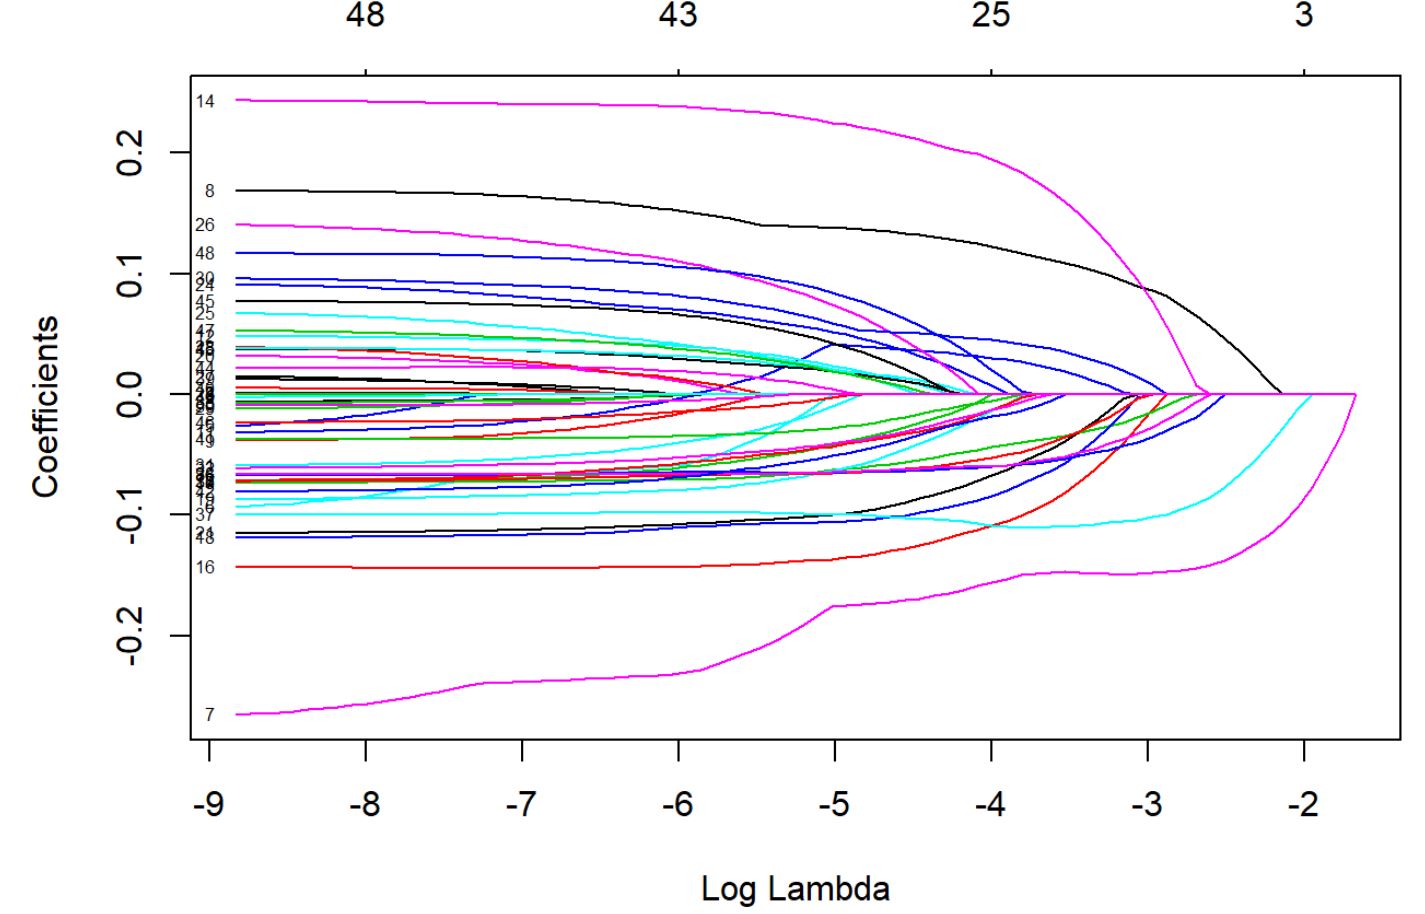
As a summary, I would like to create a catalog for the main topics I wrote on Google Blogger before July 2018. I included some figures too, most were created in R.
1. Details behind my work at Marron Institute
-
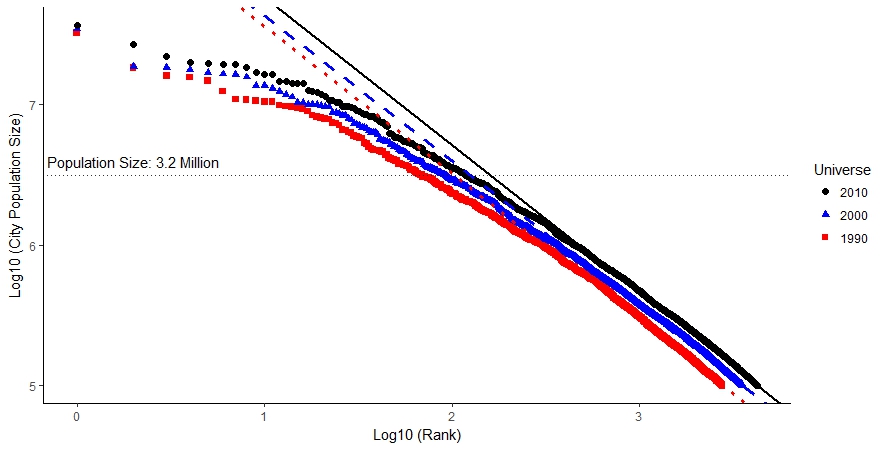
The Zipf’s Law in details and the math behind
-
How to use our city and population weights
-
How I created the city-level GDP per capita
- How I calculated the distances for airport score
2. Data Visualization
-
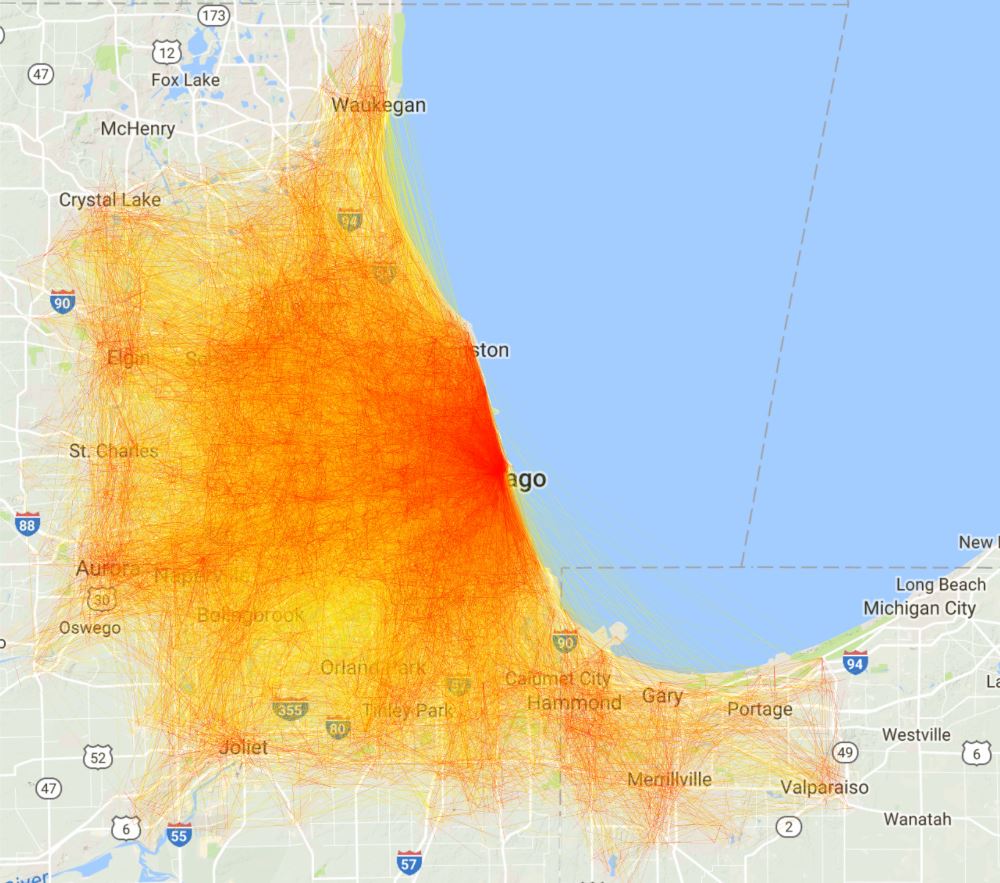
The pattern of 3.5 million commuting trips in Chicago
-
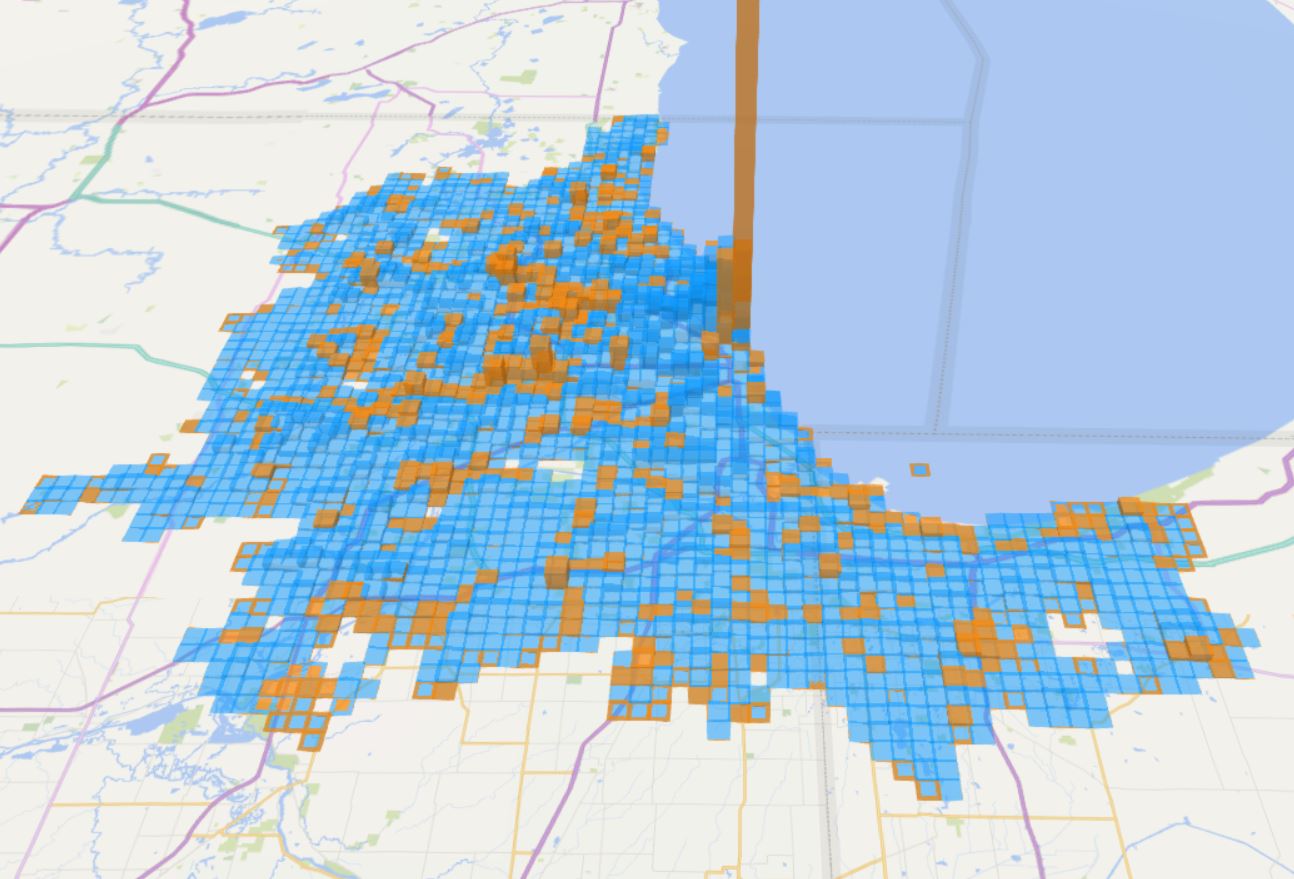
Visualization using heatmap
-
3D World Map: Air Connectivity (Airport Score)

-
Method and New Updates for Airport Score
-
Visualization of Conflicts in Colombia and the World
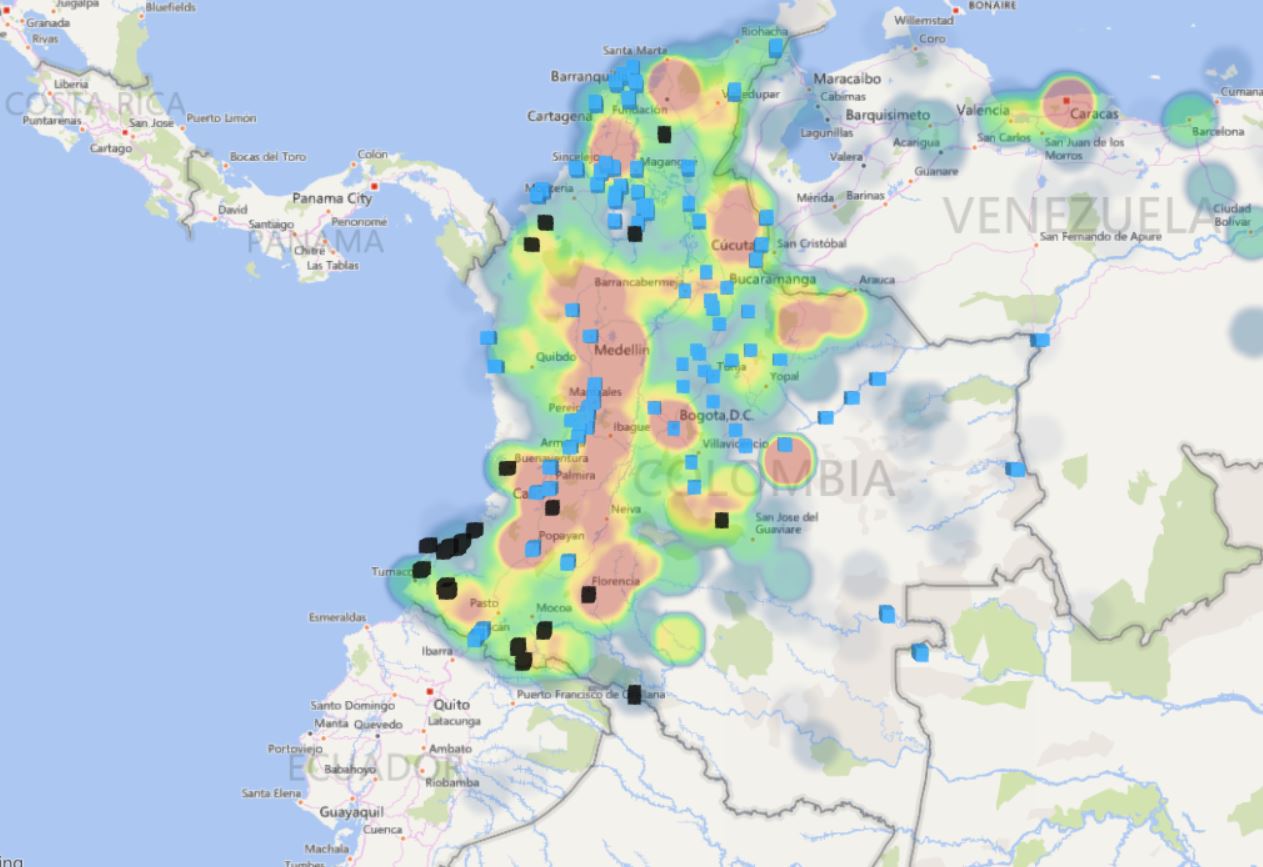
- City population, growth rate, and income
3. Introduction to Statistics
-
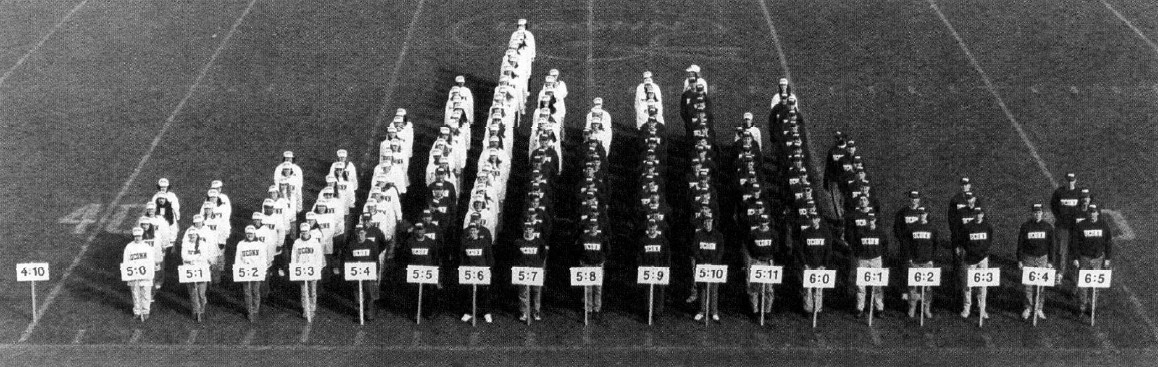
Boxplot can be viewed as a vertical histogram
-
RSS Statistic of the year: 69 Americans were killed by lawnmowers annually
-
Why a perfect correlation can mean nothing
-
Why it is so wrong to average ratios: Simpson’s paradox
-
How to calculate the weighted standard deviation
- Logistic regression can be equivalent to contingency table explained by an example
4. R programming and statistical modeling