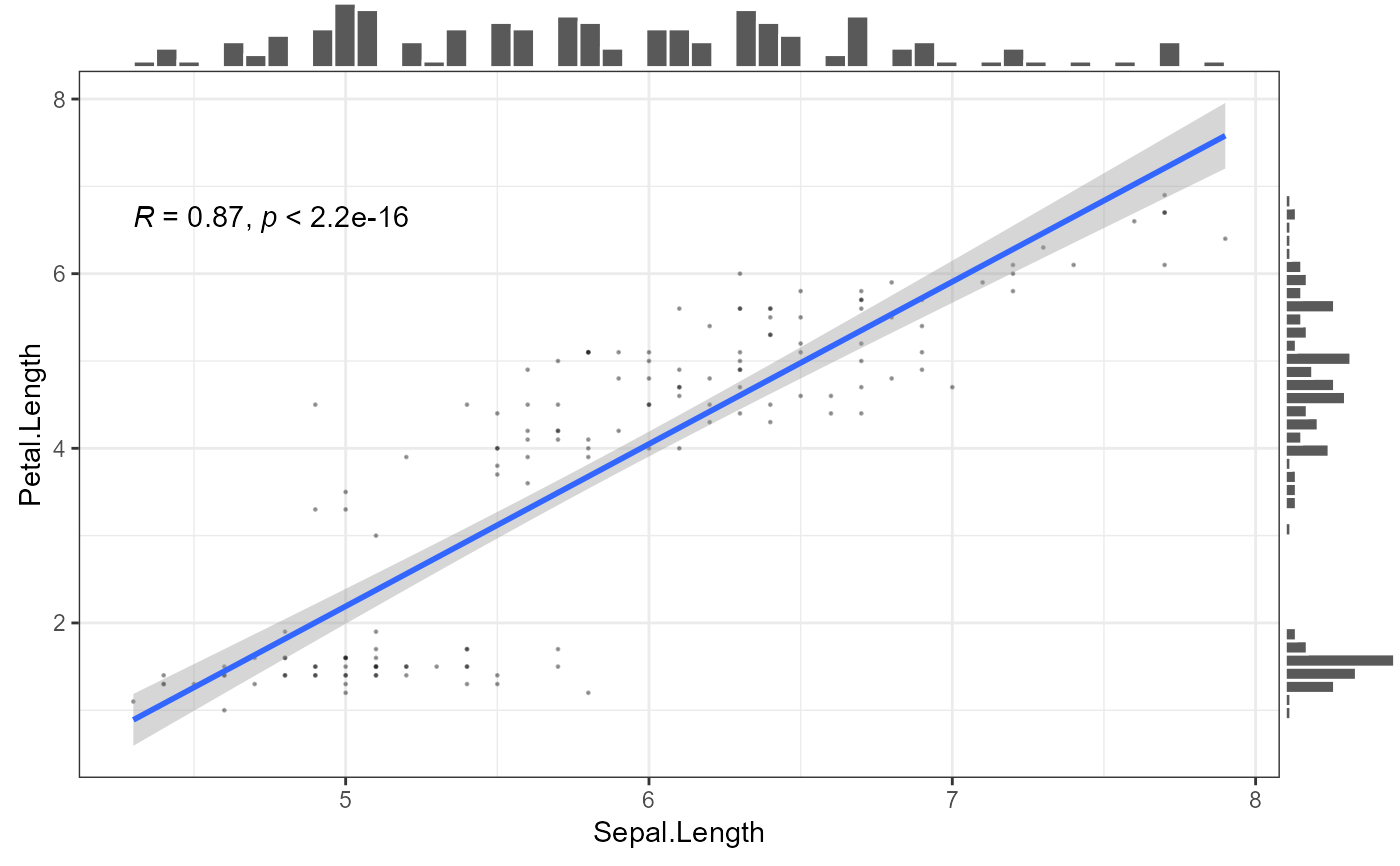
Make customized scatter plot with diagonal line and R2 printed.
Source:R/simple_plots.R
scatter.plot.diagonal.RdMake customized scatter plot with diagonal line and R2 printed.
Usage
scatter.plot.diagonal(
  data,
  x,
  y,
  size0 = 0.2,
  alpha0 = 0.3,
  dilute = FALSE,
  add_abline = FALSE,
  add_hist = TRUE,
  add_stat_cor = TRUE
)
Arguments
- data
dataset
- x
x
- y
y
- size0
point size, default to 1 of nobs<1000, 0.4 if nobs>1000
- alpha0
alpha of point
- dilute
a number or logical, dafault to TRUE, will plot
nrow(data_long)/dilutedata. For example, if dilute = 5 will plot 1/5 of the data. if dilute = TRUE will plot half of the data.- add_abline
default to FALSE, add a diagonal line
ggExtra::ggMarginalbut notice if add histogram, what is returned is no longer a ggplot2 object- add_hist
optional to add marginal histogram using
ggExtra::ggMarginalbut notice if add histogram, what is returned is no longer a ggplot2 object- add_stat_cor
add correlation and p-value from
ggpubr::stat_cor