Displays feature contributions as stacked bars for individual predictions. Each bar shows how features push the prediction above or below the baseline. Supports optional zoom-in for detailed inspection of observation clusters.
Usage
shap.plot.force_plot(
  shapobs,
  id = "sorted_id",
  zoom_in_location = NULL,
  y_parent_limit = NULL,
  y_zoomin_limit = NULL,
  zoom_in = TRUE,
  zoom_in_group = NULL
)
Arguments
- shapobs
The dataset obtained by
shap.prep.stack.data.- id
the id variable.
- zoom_in_location
where to zoom in, default at place of 60 percent of the data.
- y_parent_limit
set y-axis limits.
- y_zoomin_limit
c(a,b)to limit the y-axis in zoom-in.- zoom_in
default to TRUE, zoom in by
ggforce::facet_zoom.- zoom_in_group
optional to zoom in certain cluster.
Examples
# Example: SHAP force plots (stacked bar charts)
# Shows contribution of each feature to individual predictions
plot_data <- shap.prep.stack.data(shap_contrib = shap_values_iris,
n_groups = 4)
#> All the features will be used.
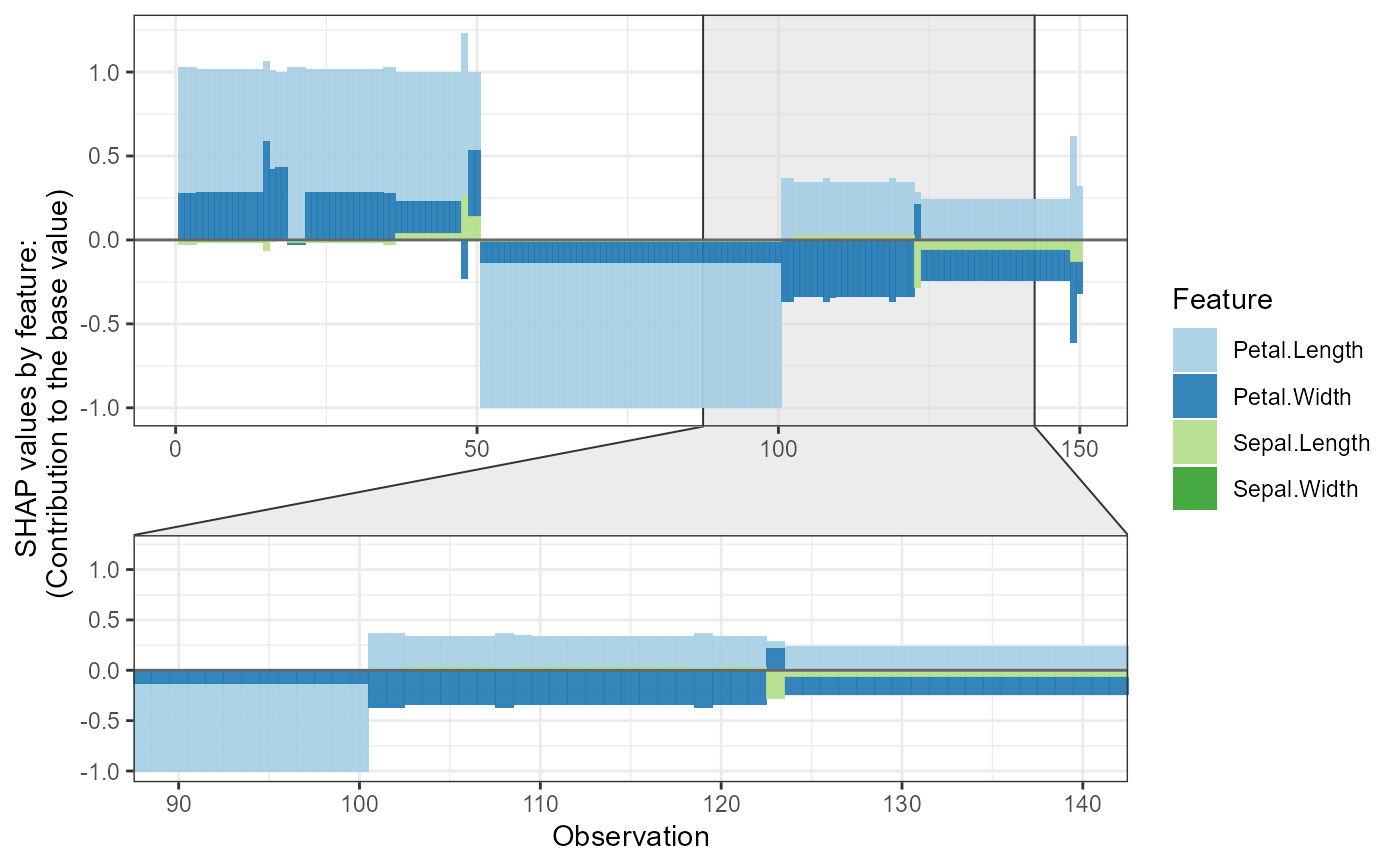
shap.plot.force_plot(plot_data)
#> Data has N = 150 | zoom in length is 50 at location 90.
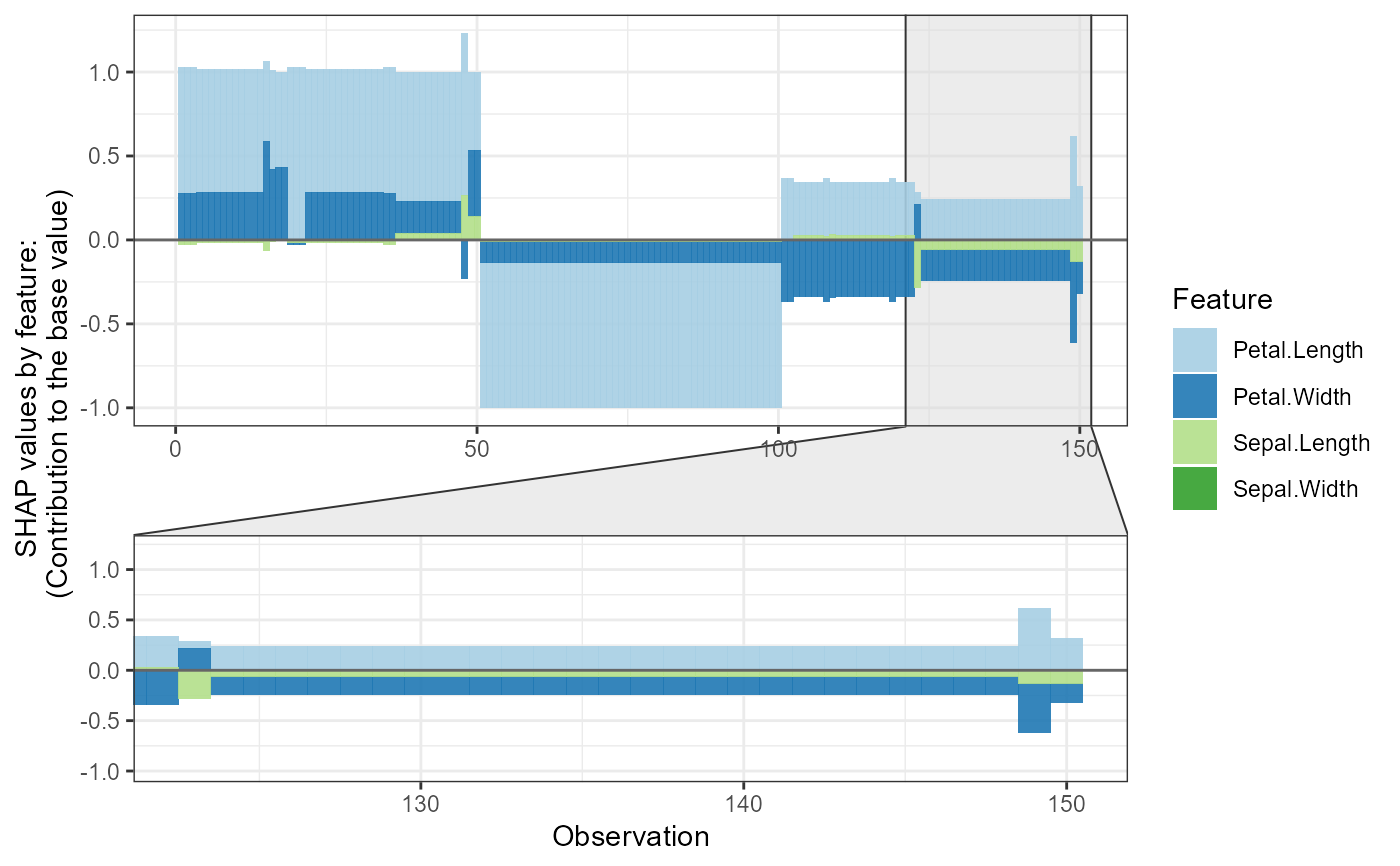
 shap.plot.force_plot(plot_data, zoom_in_group = 2)
#> Data has N = 150 | zoom in at cluster 2 with N = 28.
shap.plot.force_plot(plot_data, zoom_in_group = 2)
#> Data has N = 150 | zoom in at cluster 2 with N = 28.
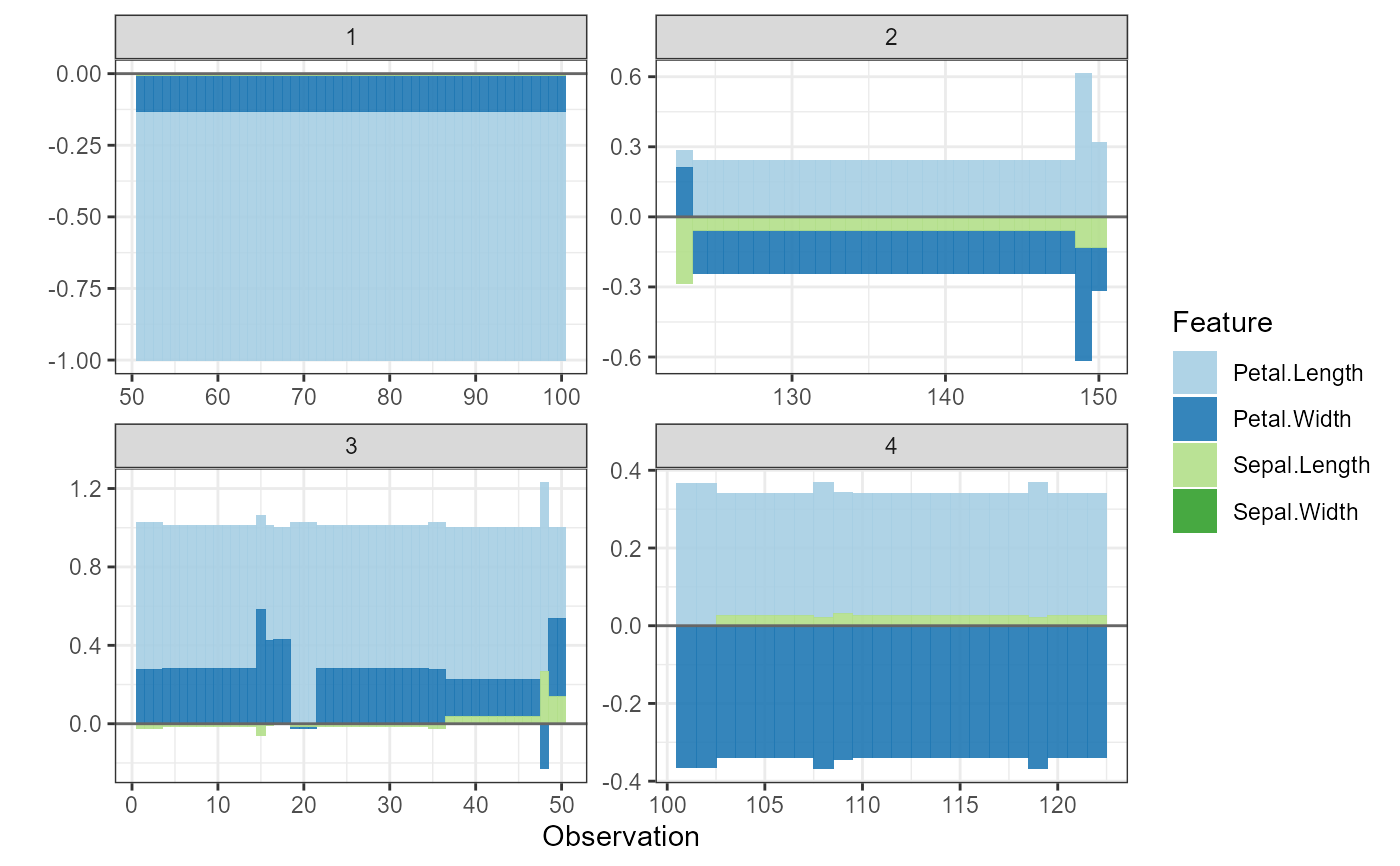
 # Plot all clusters separately
shap.plot.force_plot_bygroup(plot_data)
# Plot all clusters separately
shap.plot.force_plot_bygroup(plot_data)