Creates a faceted display with one force plot per observation cluster, allowing comparison of prediction patterns across different groups.
Examples
# Example: SHAP force plots (stacked bar charts)
# Shows contribution of each feature to individual predictions
plot_data <- shap.prep.stack.data(shap_contrib = shap_values_iris,
n_groups = 4)
#> All the features will be used.
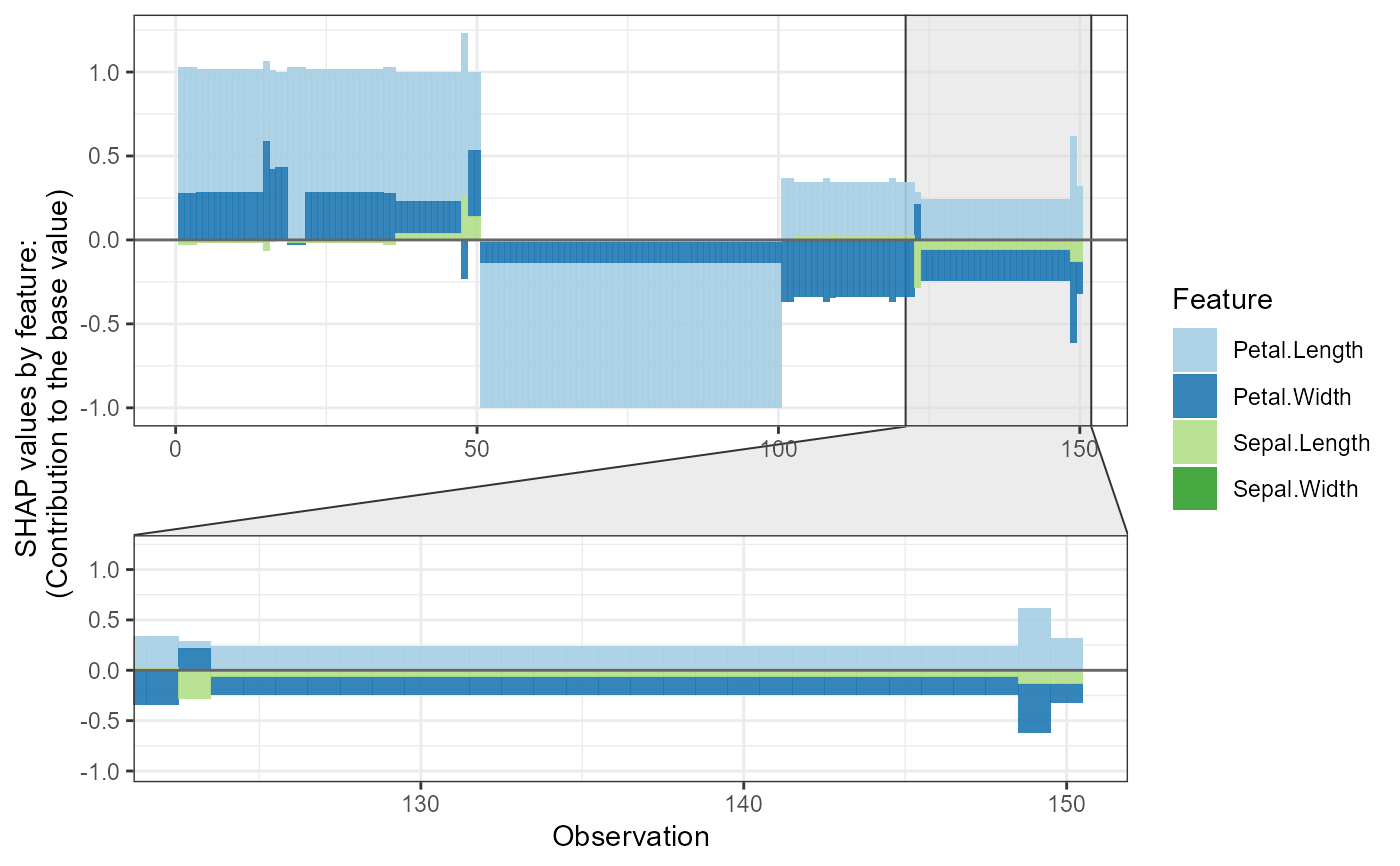
shap.plot.force_plot(plot_data)
#> Data has N = 150 | zoom in length is 50 at location 90.
 shap.plot.force_plot(plot_data, zoom_in_group = 2)
#> Data has N = 150 | zoom in at cluster 2 with N = 28.
shap.plot.force_plot(plot_data, zoom_in_group = 2)
#> Data has N = 150 | zoom in at cluster 2 with N = 28.
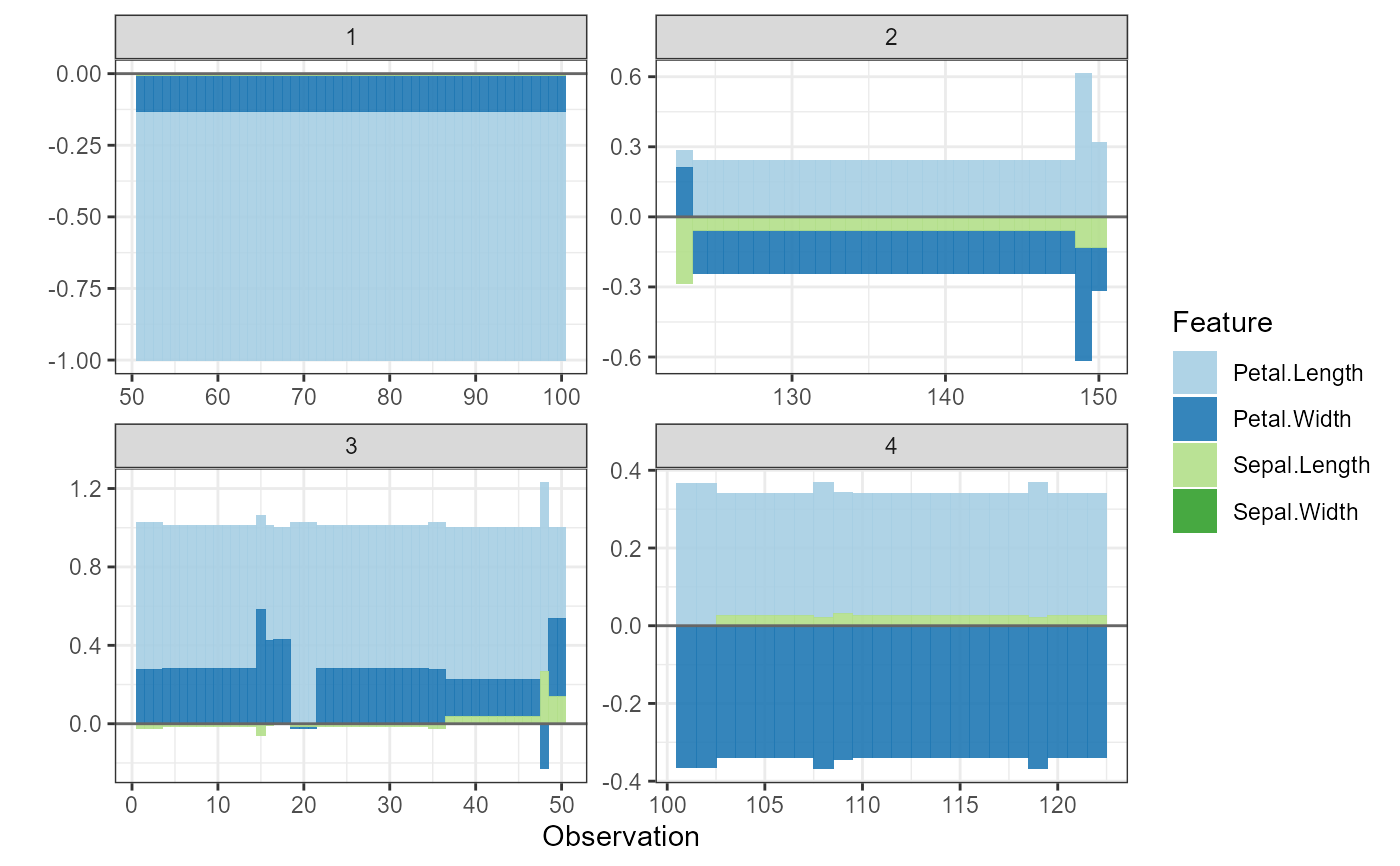
 # Plot all clusters separately
shap.plot.force_plot_bygroup(plot_data)
# Plot all clusters separately
shap.plot.force_plot_bygroup(plot_data)