shap.values returns a list of three objects from XGBoost or LightGBM
model: 1. a dataset (data.table) of SHAP scores. It has the same dimension as
the X_train); 2. the ranked variable vector by each variable's mean absolute
SHAP value, it ranks the predictors by their importance in the model; and 3.
The baseline value (intercept), which is stored in the last column of the
SHAP contribution matrix (named "BIAS" in older xgboost versions or
"(Intercept)" in newer versions). The rowsum of SHAP values including the
baseline would equal to the predicted value (y_hat) generally speaking.
Value
a list of three elements:
- shap_score
A data.table of SHAP values (without the baseline column)
- mean_shap_score
Ranked features by mean absolute SHAP value
- BIAS0
The baseline/intercept value (from the '(Intercept)' column in xgboost 3.x)
Examples
# Example: Basic workflow for SHAP summary plot
# Note: For xgboost 3.x, use xgb.DMatrix + xgb.train, and convert factor labels to numeric
data("iris")
X1 = as.matrix(iris[,1:4])
y1 = as.numeric(iris[[5]]) - 1 # Convert factor to numeric
dtrain = xgboost::xgb.DMatrix(data = X1, label = y1)
params = list(learning_rate = 1, min_split_loss = 0, reg_lambda = 0,
objective = 'reg:squarederror', nthread = 1)
mod1 = xgboost::xgb.train(params = params, data = dtrain,
nrounds = 1, verbose = 0)
# Get SHAP values and feature importance
shap_values <- shap.values(xgb_model = mod1, X_train = X1)
shap_values$mean_shap_score # Ranked features by mean|SHAP|
#> Petal.Length Petal.Width Sepal.Length Sepal.Width
#> 0.6307042 0.2135736 0.0300757 0.0000000
shap_values_iris <- shap_values$shap_score
# Prepare long-format data for plotting
shap_long_iris <- shap.prep(xgb_model = mod1, X_train = X1)
# Alternative: use pre-computed SHAP values
shap_long_iris <- shap.prep(shap_contrib = shap_values_iris, X_train = X1)
# SHAP summary plot
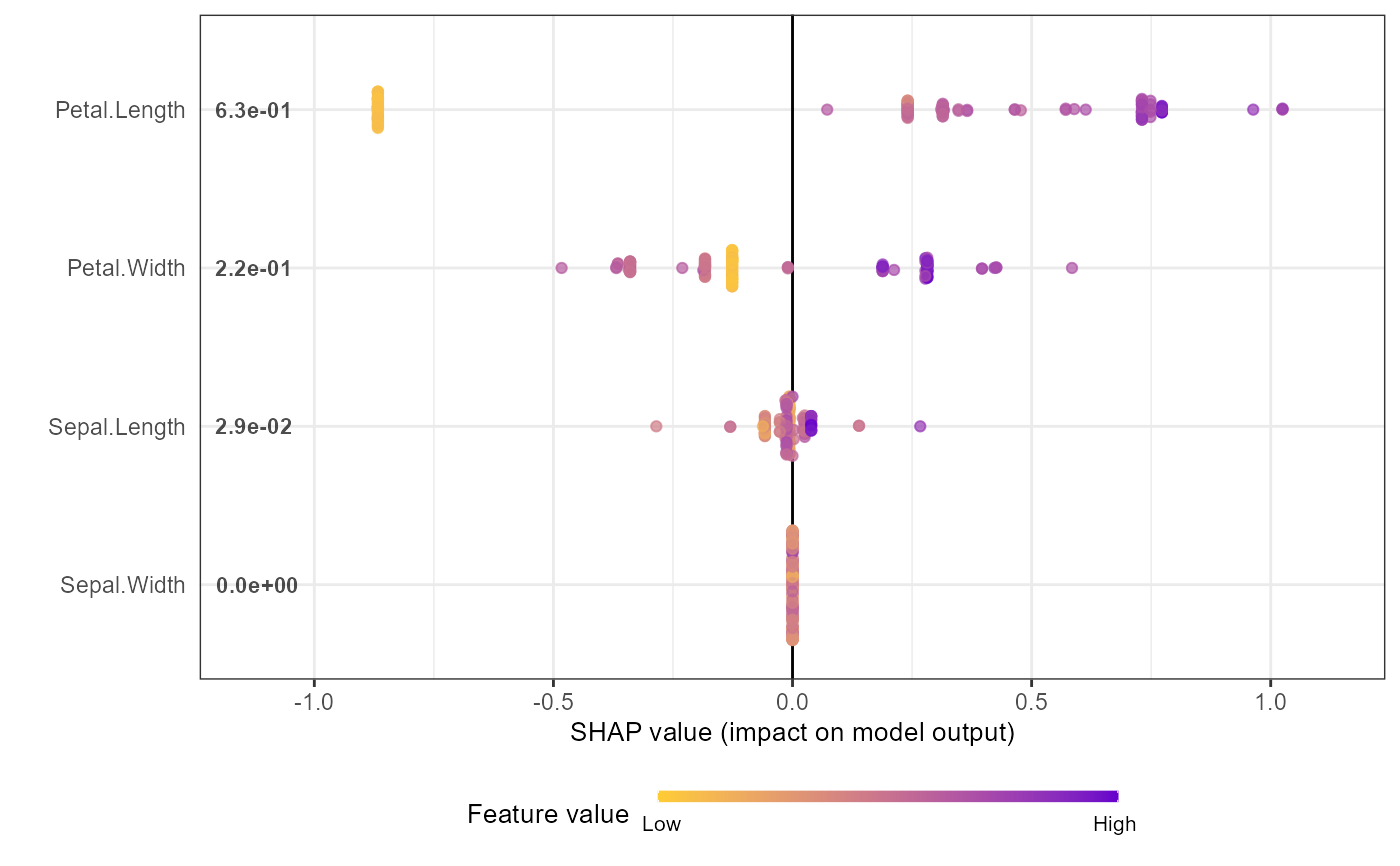
shap.plot.summary(shap_long_iris, scientific = TRUE)
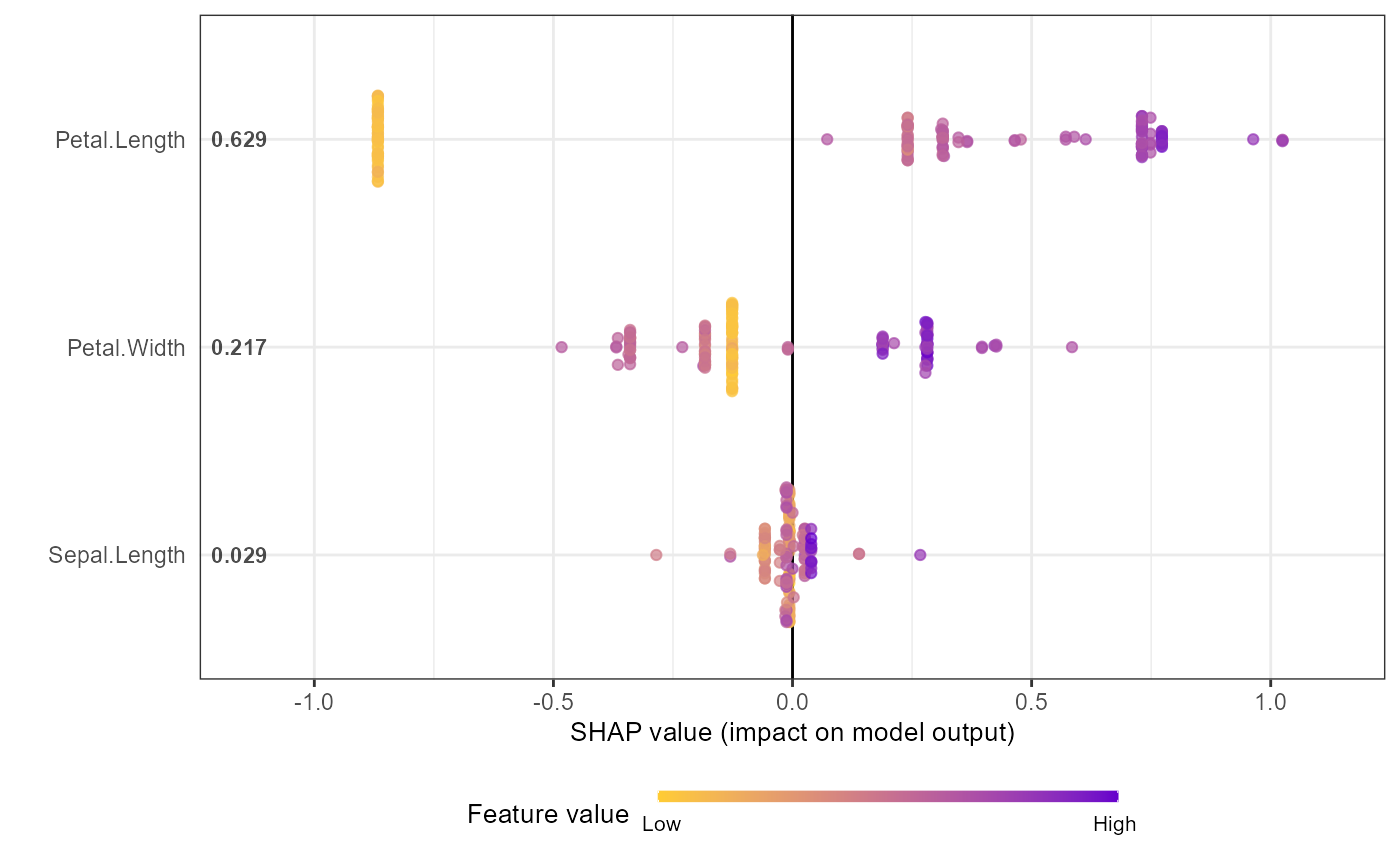
 shap.plot.summary(shap_long_iris, x_bound = 1.5, dilute = 10)
 # Alternative options:
# Option 1: directly from xgboost model
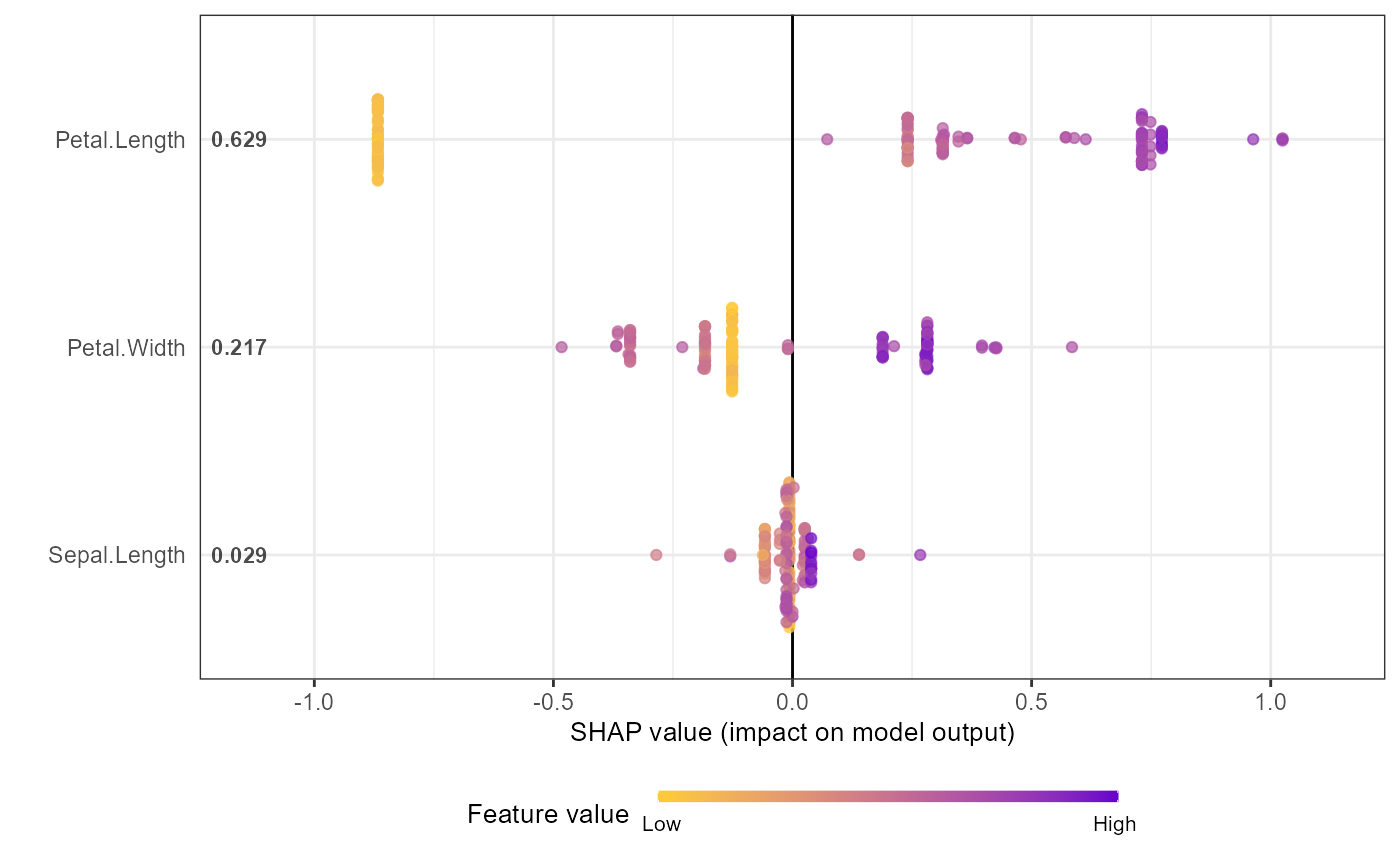
shap.plot.summary.wrap1(mod1, X = as.matrix(iris[,1:4]), top_n = 3)
# Alternative options:
# Option 1: directly from xgboost model
shap.plot.summary.wrap1(mod1, X = as.matrix(iris[,1:4]), top_n = 3)
 # Option 2: from pre-computed SHAP values (useful for cross-validation)
shap.plot.summary.wrap2(shap_score = shap_values_iris, X = X1, top_n = 3)
# Option 2: from pre-computed SHAP values (useful for cross-validation)
shap.plot.summary.wrap2(shap_score = shap_values_iris, X = X1, top_n = 3)